
Projects at Mayerfeld Consulting Data Analytics Practicum
These projects come from my Data Analytics Practicum with Mayerfeld Consulting, a remote program built around industry-style business case studies. The brief in every case was the same: start from a raw dataset and a business question, and end with something a stakeholder can act on.
E-commerce Performance Dashboards
I designed and built two Tableau dashboards on a multi-country e-commerce dataset covering roughly €3.4M in purchase value. The Revenue dashboard tracks category performance, acquisition channel mix across eight countries, and session trends by device; the Marketing Campaigns dashboard analyzes campaign spend against conversions and compares conversion and click-through rates by channel. Every chart is paired with a written takeaway – for example, that spending above the €28K median showed no conversion advantage, and that email marketing matched other channels’ 8-9% conversion rate at far lower cost.


Hypothesis Testing on National Survey Data
Working in a four-person team, I analyzed ten waves of the Young Life and Times survey (9,168 respondents) to test whether gender is associated with how important 16-year-olds in Northern Ireland consider their religious identity. After cleaning and recoding the data in Python – documenting every exclusion, from missing values to a question absent from an entire survey year – we ran a chi-square test of independence on the final sample of 7,804. The result was statistically significant (chi-square = 16.99, p = 0.002), and in the opposite direction to international patterns: boys, not girls, were over-represented at the strongest end of the scale.
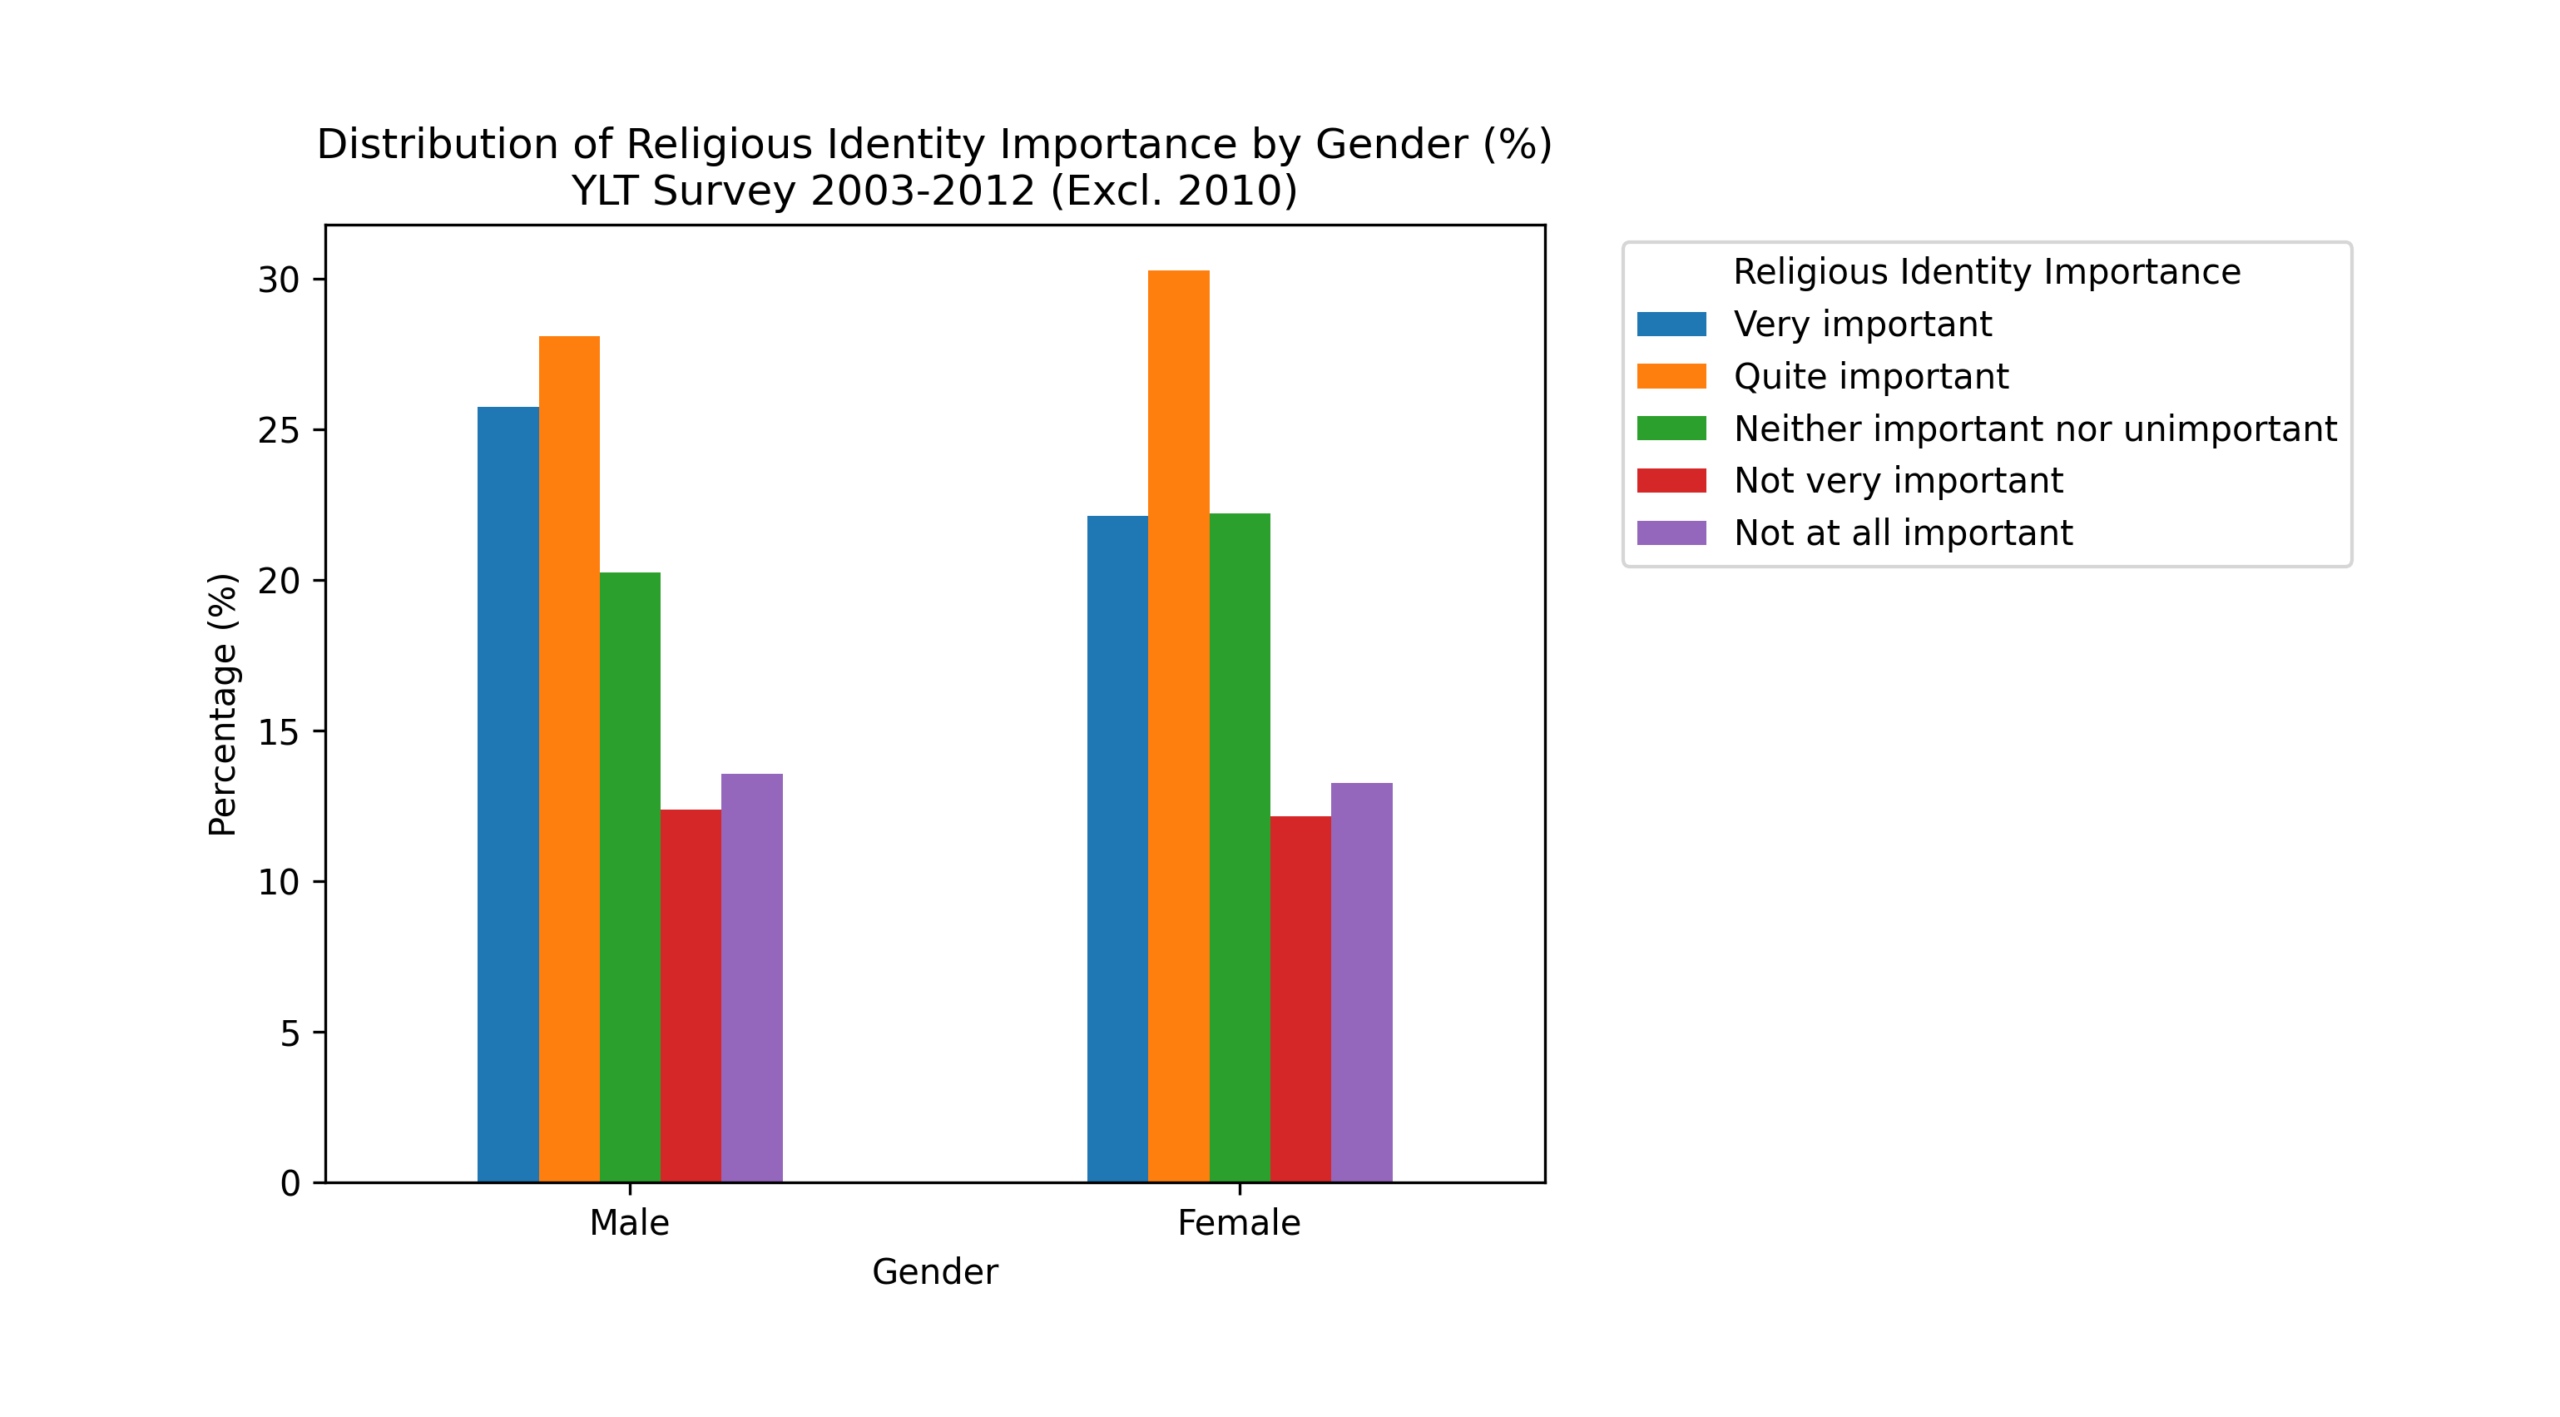
Result
χ²(4) = 16.99
p = 0.00195
H₀ rejected at α = 0.05
n = 7,804
| Variable | Code | Reason | N excluded |
|---|---|---|---|
| rsex | 99 | Missing | 42 |
| relidimp | 9 | Don't know - not analytically useful | 19 |
| relidimp | 99 | True missing | 75 |
| relidimp | 999 | Question not included in 2010 wave | 786 |
| relidimp | 6 | Qualitative opt-out, not part of ordinal scale | 451 |
| N | |
|---|---|
| Original sample | 9,168 |
| Total excluded | 1,364 |
| Final clean sample | 7,804 |
| of which: Male | 3,171 |
| of which: Female | 4,633 |
